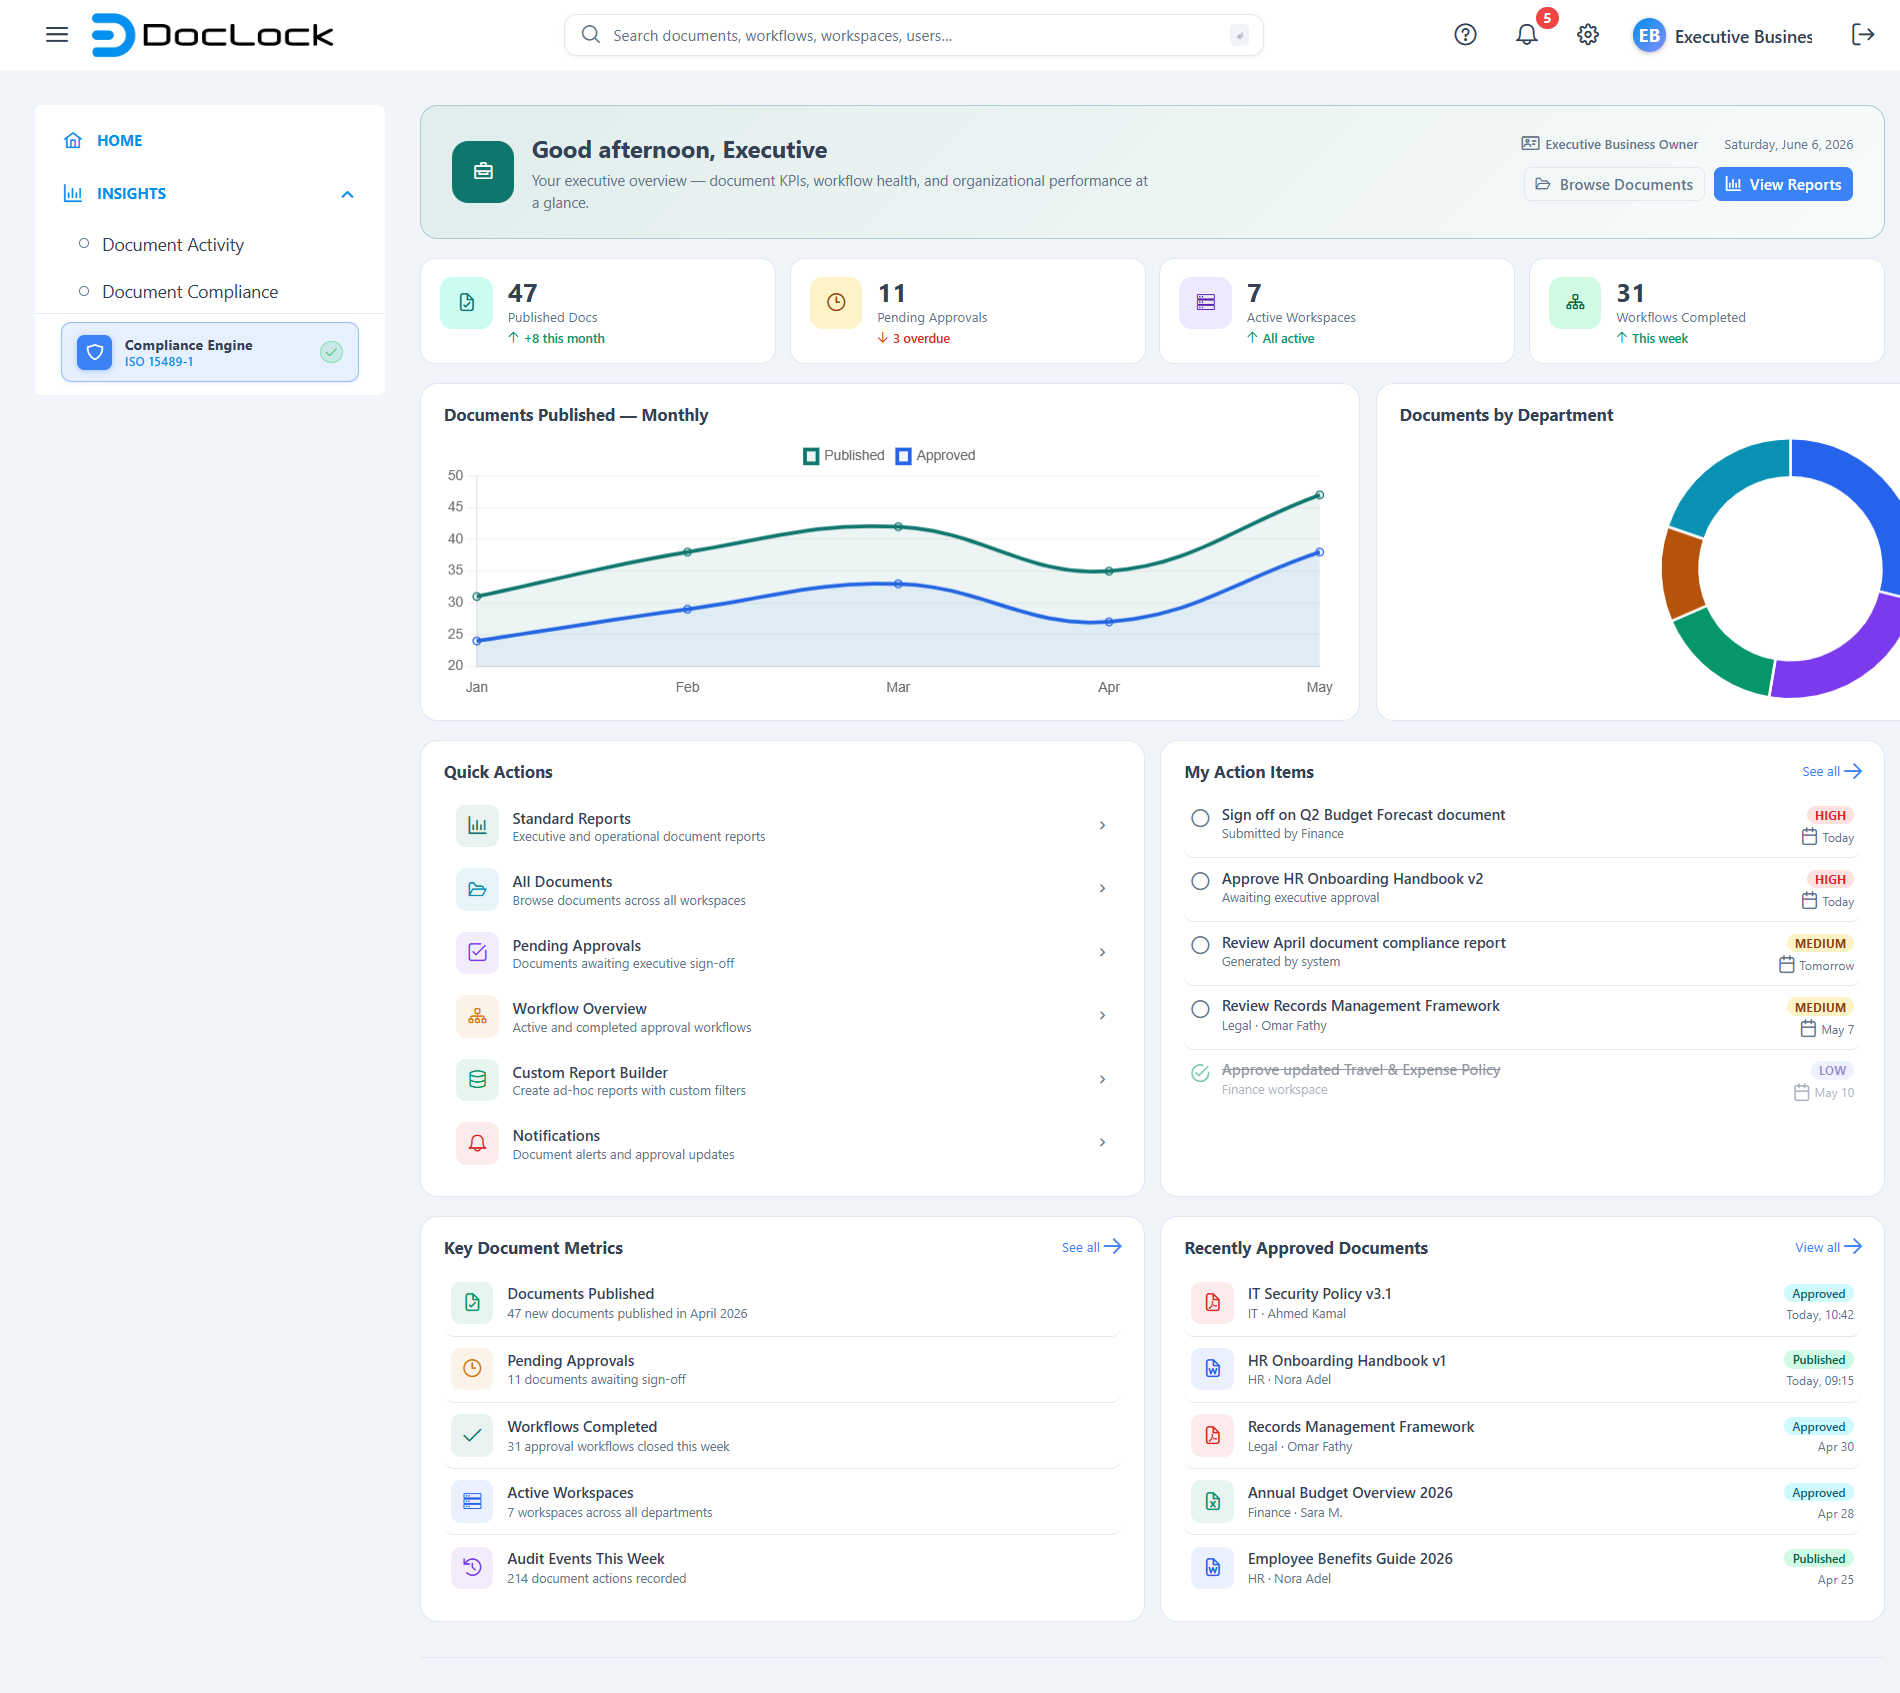
Home Dashboard
The Home dashboard is the first screen you land on after signing in. It is a personalized "command center" that greets you by name and adapts to who you are — an executive sees document KPIs and approvals, a knowledge worker sees their own files and tasks, an administrator sees users and system health, and so on. The cards, charts, quick actions, and tasks on the page all change to match your role.
How to open this page
- It opens automatically right after you log in.
- You can return any time by clicking the DocLock logo (top-left) or the Home item in the left navigation menu.
- Route:
/home - Access: Available to every signed-in user. The exact dashboard you see depends on your user type (role).
The dashboards adapt to your role (personas)
DocLock builds the dashboard from your assigned user type. There are six built-in dashboards, each with its own banner color, headline buttons, KPIs, charts, and quick actions:
| User type | Banner focus | Highlighted buttons | Example KPIs |
|---|---|---|---|
| Super User | Full system overview | All Documents · Manage Users | Total Documents, Workspaces, Pending Approvals, Active Workflows |
| Executive Business Owner | Executive KPIs at a glance | View Reports · Browse Documents | Published Docs, Pending Approvals, Active Workspaces, Workflows Completed |
| Departmental Manager | Department command center | My Documents · Team Dashboard | Department Docs, Pending Approvals, Docs in Review, Workspaces |
| Knowledge Worker | Your personal workspace | My Documents · Upload Document | My Documents, Published, In Review, Workspaces |
| Compliance & Legal Officer | Governance & compliance | Audit Trail · Legal Holds | Audit Events, Active Legal Holds, Pending Reviews, Compliance Docs |
| System Administrator | System administration hub | Manage Users · Manage Roles | Total Users, Defined Roles, Active Workflows, Workspaces |
Note: Only the Super User dashboard includes the extra Storage Utilization panel. If your role changes, sign in again to see the matching dashboard.
If your account has a user type that doesn't match one of these, DocLock falls back to the Knowledge Worker dashboard.
What you see on this page
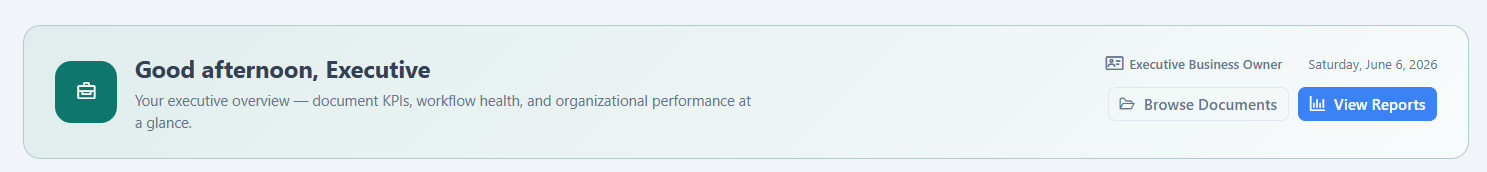
1. Welcome banner
A colored banner across the top shows:
- A time-of-day greeting with your first name (e.g. "Good morning, Nora") — it changes between Good morning, Good afternoon, and Good evening based on the current time.
- A short description of what your dashboard focuses on.
- A role pill showing your user type, and today's date.
- Two shortcut buttons (a primary and a secondary action) tailored to your role.
2. KPI stat cards
A row of four stat cards shows headline numbers for your role — for example Total Documents, Pending Approvals, or Active Workflows. Each card shows the value, a label, and a small trend line (an up or down arrow with a note like "+11 this month" or "3 overdue").
Click any stat card to jump straight to the related screen (for example, clicking Workspaces opens the workspaces list).

3. Charts
One or two charts visualize trends for your role — such as Documents by Status, Documents Published — Monthly, Audit Events, or Users by Role. They are read-only summaries.
4. Storage Utilization (Super User only)
Super Users get an extra panel showing how much storage each workspace is using, with a colored progress bar per workspace. Bars turn red when a workspace passes 75% of its allowance.
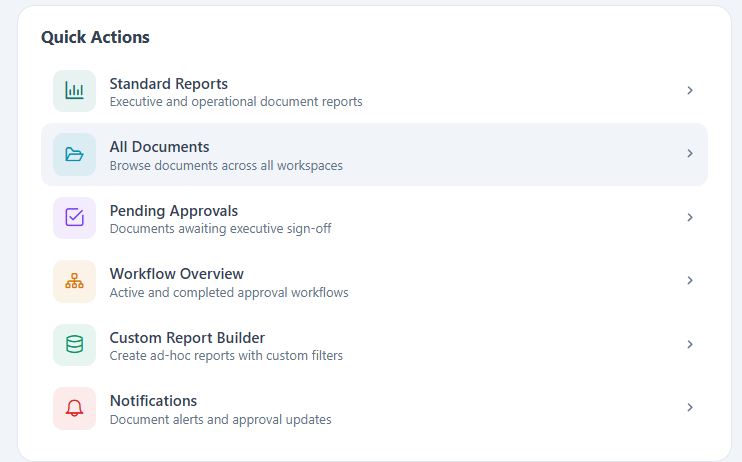
5. Quick Actions
A grid of shortcut tiles for the tasks you do most. Each tile has an icon, a title, and a short description (for example Upload Document, Advanced Search, Audit Trail, Manage Users). Click a tile to go straight to that screen.
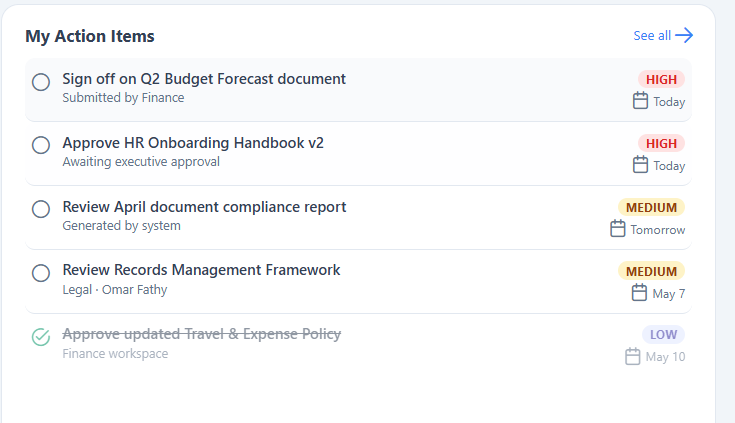
6. My Tasks
A checklist of items that need your attention, each with a title, context, a priority tag (high / medium / low), and a due date.
7. Activity and recent items
The bottom of the page has two list cards — typically a recent activity / pending items feed and a recent documents list. Each row links through to the relevant screen, and many show a colored status badge (Published, In Review, Approved, Draft, Archived).
Walkthrough: jump to a screen from a KPI
- Find the stat card you're interested in (for example Pending Approvals).
- Click anywhere on the card.
- DocLock opens the linked screen (for approvals, that's the documents list).
Walkthrough: check off a task
- In the My Tasks card, find the task you've finished.
- Click the circle on the left of the task — it turns into a checkmark and the task is shown as done.
- Click it again to mark it as not done.
Note: Ticking a task here is a quick visual marker on the dashboard for the current view. To actually act on a task, click the task title, which opens the related document or screen.
Walkthrough: use a Quick Action
- Scroll to the Quick Actions grid.
- Click the tile that matches what you want to do — e.g. Advanced Search or Upload Document.
- DocLock takes you directly to that feature.
Tips
- Use the two banner buttons as your fastest path to your most common destinations.
- Watch the trend arrows on the KPI cards — a red down-arrow (e.g. "3 overdue") is a cue that something needs attention.
- The figures, charts, tasks, and activity shown are demonstration data for the signed-in persona; they illustrate how the dashboard is laid out rather than live production totals.
- Super Users: keep an eye on the Storage Utilization bars — red bars mean a workspace is near capacity.
Troubleshooting
| Problem | What to check |
|---|---|
| The dashboard looks different from a colleague's | That's expected — the layout, KPIs, and quick actions are chosen by your user type. |
| I see the Knowledge Worker layout but expected another | Your account's user type may not be set to a specific persona; ask your administrator to confirm your role. |
| The greeting shows the wrong time of day | The greeting uses your device's local clock; check your computer's time settings. |
| A checked-off task came back after refresh | Task check-offs are a quick visual marker on the dashboard view, not a saved status. Open the task to act on it. |
| Clicking a card does nothing | Make sure you clicked the card itself; each KPI, quick action, and list row links to its related screen. |